Edit the highlighted input cells; calculated results update automatically.

What's inside

  • Twelve monthly columns plus a full-year total column
  • Revenue, cost of goods sold, payroll, contractors, rent, software, marketing, insurance, fees, travel, supplies, and other expenses
  • Automatic gross profit, operating profit, and net profit
  • Gross margin, net margin, and break-even revenue calculations
  • Full-year sample data and instructions sheet

Best for: Small business owners · Founders reviewing monthly results · Bookkeepers preparing management reports

What is a profit and loss statement?

A profit and loss statement, also called a P&L or income statement, summarizes revenue, costs, and expenses for a period. It shows gross profit, operating profit, net profit, and margins.

Small businesses use a monthly P&L to review performance, prepare management reports, and understand which costs are growing.
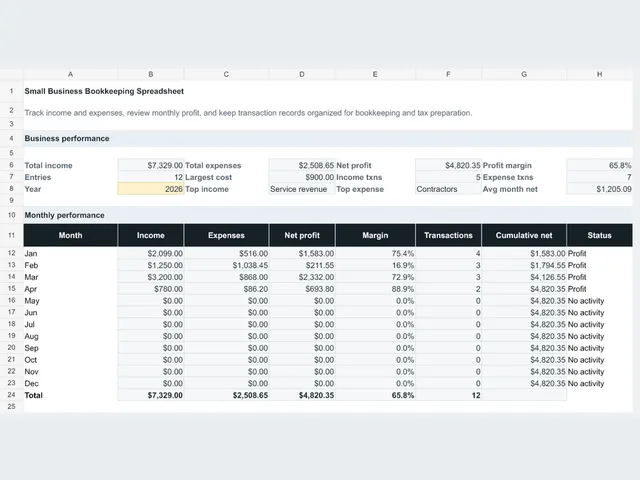
How to build a P&L in Excel

List revenue at the top, then subtract cost of goods sold to calculate gross profit. Subtract payroll, contractors, rent, software, marketing, insurance, fees, travel, supplies, and other operating expenses to reach operating profit.

Add other income or expenses and tax where applicable. The workbook includes twelve monthly columns and a full-year total column so each line can be compared over time.

Gross profit, net profit, and break-even revenue

Gross profit measures revenue after direct costs. Net profit is what remains after all operating costs, other items, and tax.

Break-even revenue is the estimated sales level needed to cover fixed costs and variable costs. Review it with actual margins rather than relying on one month of results.

Use in Google Sheets

Open a ready-made copy in Google Sheets, or keep the XLSX file for Excel.

Make a copy in Google Sheets

Made for practical spreadsheet work by the Digital Store team. Formulas and example values are checked against the downloadable workbook; updated October 7, 2026. Use the file as a planning aid and verify decisions with your own records or professional advisor where appropriate.

Worked example

Full-year sample included in the workbook

Inputs

Product sales
$364,700 annual sample
Service revenue
$183,250 annual sample
Cost of goods sold
$204,250 annual sample
Operating expenses
$263,210 annual sample

Outputs

Annual revenue
$553,150
Gross profit
$348,900
Net profit
$61,340
Net margin
11.1%
Break-even revenue
$417,296.11

The sample values demonstrate the formulas. Replace them with your own accounts and confirm tax treatment with a qualified professional.

Related free templates

View Bookkeeping & P&L

Customer feedback

No reviews yet. Try the file and be the first to share how it worked for you.
Write a review

Download this file first to unlock review submission.

Your rating

FAQ

What is a profit and loss template?

It is a reusable income statement format for recording revenue, direct costs, operating expenses, tax, and net profit over a chosen accounting period.

How is a P&L different from a balance sheet?

A P&L reports income and expenses over a period. A balance sheet reports assets, liabilities, and equity at a point in time.

What belongs in cost of goods sold?

Cost of goods sold generally includes direct costs tied to the products or services sold, such as materials, production labor, and direct delivery costs. Confirm treatment with your accountant.

Can I use this profit and loss template for a small business?

Yes. The workbook is designed for small business management reporting with monthly columns, annual totals, margins, and break-even calculations.

Can I open the P&L template in Google Sheets?

Yes. Download the XLSX file and import it into Google Sheets, or follow the import steps shown on this page.

Questions? Contact us